Performance/Financial Information
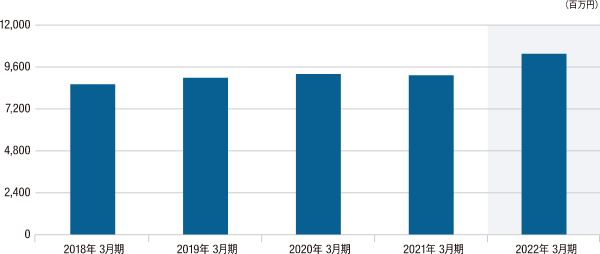
amount of sales
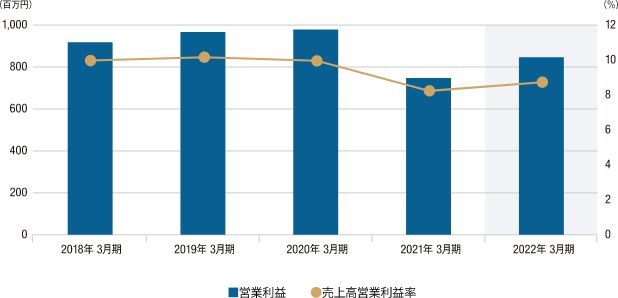
Operating Income/Operating Income Margin
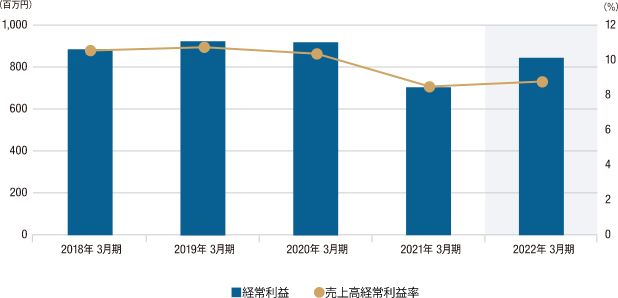
Ordinary Income/Ratio of Ordinary Income to Net Sales
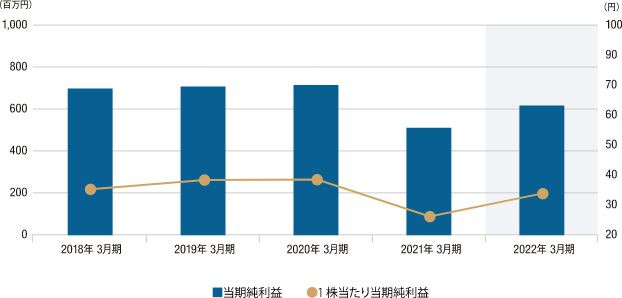
Net income/Net income per share
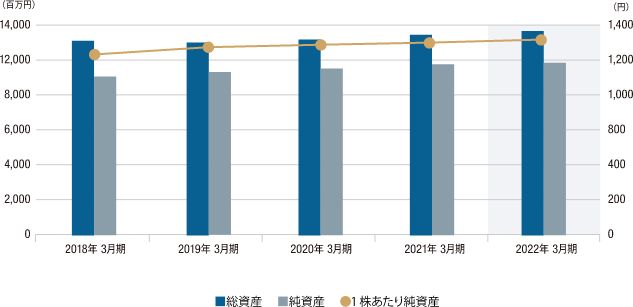
Total assets/Net assets/Net assets per share
Five-year financial highlights
| Year ended March 31, 2018 | Fiscal year ended March 31, 2019 | Fiscal year ending March 31, 2020 | Fiscal year ending March 31, 2021 | Fiscal year ending March 31, 2022 | |
|---|---|---|---|---|---|
| Sales (million yen) | 8,797 | 9,046 | 9,394 | 9,213 | 10,572 |
| Operating income (million yen) | 936 | 970 | 987 | 751 | 926 |
| Ordinary income (millions of yen) | 965 | 1003 | 1015 | 771 | 931 |
| Attributable to parent company shareholders Net income (million yen) | 675 | 694 | 696 | 498 | 604 |
| Net assets (million yen) | 10,434 | 10,715 | 10,951 | 11,430 | 11,517 |
| Total assets (million yen) | 12,804 | 12,769 | 12,969 | 13,405 | 13,824 |
| Operating Income Margin (%) | 10.6 | 10.7 | 10.5 | 8.2 | 8.8 |
| Ordinary profit margin (%) | 11.0 | 11.1 | 10.8 | 8.4 | 8.8 |
| Net income per share (yen) | 77.95 | 80.48 | 80.86 | 57.87 | 35.06 |
| Net assets per share (yen) | 1,203.7 | 1,242.5 | 1,263.4 | 1,293.9 | 652.9 |
*On October 1, 2021, we conducted a stock split at a ratio of 1:2. "Net Income per Share" and "Net Assets per Share" have been retroactively adjusted for stock splits.


